Summary & Revenue Dynamics: H2 2025
Indie Music Rights (IMR) operates a sophisticated revenue model comprising 17 distinct revenue streams. For the second half of 2025 (H2), approximately 90% of estimated total revenues are derived from streaming in 2025.
Core Revenue Categories:
Streaming & DSPs (Digital Service Providers)
This is our primary revenue driver. IMR’s "flywheel" ensures that metadata is precision-tuned so we can accurately claim and collect royalties from global platforms like Spotify, Apple Music, and Tidal.Reporting Lag: It typically takes 3 months to aggregate global consumption data into a final "statement," which then serves as the basis for IMR’s actual payouts.
Neighboring Rights (Performance Royalties)
These involve revenues from public performances, such as radio broadcasts and background music in retail spaces. This sector is often considered a "Black Box" because significant sums remain unclaimed globally. IMR estimates a 20% market upside through aggressive collection in this area.Time Horizon: Due to the nature of collection societies, these payouts can take up to two years to realize.
Sync & Licensing
Revenue generated from the placement of music in film, television, advertising, and gaming.YouTube & User-Generated Content
Optimization of rights claims and monetization via Content ID (to be updated with the latest figures from the Friday meeting).
Historical Claims:
IMR has the capability to audit and claim royalties retroactively. We anticipate setting a specific growth percentage based on these efforts in H2 2026.
The 17 Revenue Streams of the IMR Flywheel:
Our model ensures every data point is optimized to capture value across the following categories:
A. Digital Consumption (Streaming & DSPs)
Interactive Premium Streaming: On-demand plays from paid subscribers (Spotify, Apple Music, Tidal).
Ad-Supported Streaming: Revenue from free-tier users on digital platforms.
Digital Downloads: Permanent purchases via stores like iTunes or Bandcamp.
Cloud Locker Services: Revenue from music stored and played via cloud services (Amazon, iTunes Match).
B. Social Media & User-Generated Content (UGC)
5. YouTube Content ID: Automated revenue from third-party videos using IMR music.
6. YouTube Premium: Share of subscription revenue from YouTube’s ad-free service.
7. TikTok Licensing: Micro-royalties from user-generated clips and trends.
8. Meta (Instagram/Facebook) Monetization: Use of music in Reels, Stories, and posts.
C. Neighboring Rights & Public Performance (Master Side)
9. Terrestrial Radio: Performance rights (royalties) for broadcast airplay (International).
10. Digital Radio/Webcasting: Revenues from non-interactive services like SiriusXM or Pandora.
11. Public Performance (B2B): Background music in retail, restaurants, gyms, and shopping malls.
12. Secondary Use Fees: Collection for use in TV broadcasts and cable retransmissions.
D. Sync & Specialized Licensing
13. Sync Master License Fees: Upfront fees for placement in Film, TV, and Advertising.
14. Gaming & eSports: Licensing music for in-game soundtracks or virtual events.
15. In-Flight & Transit Entertainment: Licensing for airlines, trains, and cruise ships.
E. Optimization & Recovery
16. Historical Back-Claims: Retroactive collection of missed royalties (up to 3–5 years back).
17. "Black Box" Redistribution: Reclaiming unmatched funds from global collection societies.
Critical Insights for Stakeholders
Reporting Lag: While streaming is our engine, it operates on a 3-month delay. Consumption in October is not fully statemented until January.
The Black Box Upside: Neighboring Rights (Streams 9–12) represent a significant growth area. Due to complex global data trails, these can take up to 2 years to fully collect, but we anticipate a 20% upside through IMR’s active data cleansing.
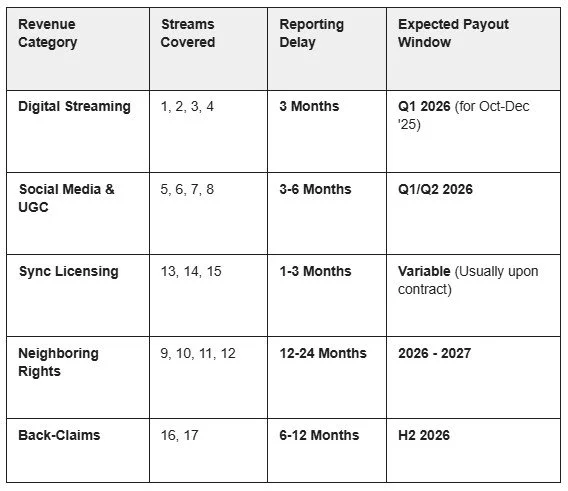
IMR Revenue Collection Timeline
This Revenue Calendar visualizes the standard "payout lag" in the music industry. It helps explain why consumption happening today doesn't necessarily reflect as cash in the bank for several months.
Why the Delay?
Data Processing: DSPs (Spotify/YouTube) need 30–60 days just to process billions of rows of global stream data.
Collection Societies: For Neighboring Rights, money often travels from a foreign society (e.g., PPL in the UK) to a domestic one (e.g., Gramo in Norway) before reaching IMR. Each "hop" adds 6 months of delay.
The "Flywheel" Effect: While the lag is long, once the IMR flywheel is spinning, you receive a steady stream of "old" revenue (from 2 years ago) alongside "new" revenue (from 3 months ago), creating a more stable financial baseline.